An accelerator becomes a practical alternative when the required model and libraries run on it, performance meets the service target, and the engineering cost of migration is justified. Peak FLOPS alone cannot settle that question. Software support, energy use, compute density and the behavior of the complete system all matter.
For this comparison, assume that an NVIDIA system and an Ascend system are both available in the laboratory. The question is straightforward:
How large is the technical gap between Ascend and NVIDIA?
If NVIDIA is faster, the measurement should show it. If it consumes less energy per useful token, that result should be recorded. Equally, if Ascend runs a workload within the required service-level agreement (SLA), the absence of CUDA alone does not make that system unusable.
Before comparing the hardware, one qualification matters: large language models (LLMs) are only one part of AI. Predictive maintenance, anomaly detection in sensor data, demand forecasting, quality inspection and energy optimization are also important applications. At typical organizational scales, many specialized models for these tasks do not need large numbers of GPUs for inference. A CPU, a small accelerator or a limited number of GPUs may be sufficient. Training requirements must be assessed separately; model size, request rate and latency targets still determine the capacity needed. The same workload-first principle underlies choosing a GPU for AI.
This difference explains the focus on language models here. Serving large LLMs can require substantial memory and accelerator capacity to hold weights, maintain a growing key–value (KV) cache for longer contexts and concurrent requests, generate tokens sequentially, and exchange data between accelerators. At that scale, memory bandwidth, interconnects, kernels and the serving engine directly affect service capacity and cost. I therefore concentrate on language-model training and inference, particularly large-model serving. Smaller language models do not automatically need large clusters: matching model size to the task remains the starting point. Other AI applications need their own workload-specific measurements.
First, identify what is being compared
“Ascend vs NVIDIA” is too broad to be a useful hardware comparison.
Ascend 910C, used in CloudMatrix384 and the A3 generation, is different from Ascend 950PR and 950DT. Even 950PR and 950DT, which belong to the same generation, target different workloads. Huawei designed 950PR for prefill and recommendation systems, and 950DT for decode and training, reflecting their different compute and memory-bandwidth requirements. Huawei
On the NVIDIA side, H200 and B300 also belong to different generations. H200 is a useful reference for existing data-center infrastructure; B300 represents Blackwell Ultra, with substantially greater compute capacity, memory and interconnect bandwidth. H200 has 141GB of HBM3e, 4.8TB/s of memory bandwidth and 900GB/s of NVLink bandwidth. For B300 in HGX, official documents report 270–288GB and 7.7–8TB/s, depending on the document/configuration; fifth-generation NVLink provides 1.8TB/s per GPU. H200 specifications · Blackwell Ultra datasheet
I use four references: Atlas 350 with 950PR for prefill, Atlas 650E with 950DT, H200 as an established Hopper reference, and B300 as the newer NVIDIA reference.
Chip specifications and product specifications are different
An early example shows why comparing datasheets is less straightforward than it appears.
For the 950PR processor itself, Huawei advertises up to 128GB of memory, 1.6TB/s of bandwidth and 1,784TFLOPS. But Atlas 350, the actual card built around that processor, has 112GB, 1.4TB/s, 425TFLOPS in BF16/FP16 and 804TFLOPS in mxFP8. The card’s maximum power consumption is 600W. Ascend processor specifications · Atlas accelerator cards
For 950DT, Huawei’s 2025 roadmap described 144GB of HiZQ 2.0 memory with 4TB/s of bandwidth. The current Atlas 650E product page, however, specifies 8×96GB for its eight 950DT processors: the same bandwidth, but less capacity. I use the current product specification rather than the roadmap figure, because I have not found a clear public explanation for the difference. Huawei roadmap · Atlas 650E specifications
The same rule applies to NVIDIA: architecture capabilities, maximum chip specifications and the configuration installed in a particular server are three different things.
The raw comparison: the gap is not a single number
The table compares products as consistently as the available specifications allow. Where NVIDIA reports Tensor Core throughput assuming sparsity, I use the dense value.
| Metric | Ascend 950PR in Atlas 350 | Ascend 950DT in Atlas 650E, per NPU | H200 SXM | B300 in HGX, per GPU |
|---|---|---|---|---|
| Target workload | Prefill / recommendations | Decode / training | General training and inference | General training and inference |
| Theoretical BF16/FP16 | 425 TFLOPS | 425 TFLOPS | ≈990 dense TFLOPS | ≈2.25 dense PFLOPS |
| FP8 or comparable family | 804 TFLOPS | ≈804 TFLOPS | ≈1.98 dense PFLOPS | ≈4.5 dense PFLOPS |
| Accelerator memory | 112GB | 96GB in the current Atlas 650E | 141GB | 270–288GB |
| Memory bandwidth | 1.4TB/s | 4.0TB/s | 4.8TB/s | 7.7–8TB/s |
| Intra-system interconnect | 318GB/s per card in a four-card full mesh | 784GB/s/NPU, bidirectional, in the eight-NPU server | 900GB/s NVLink | 1.8TB/s NVLink |
| Power specification | ≤600W per card | 14.5kW for the complete eight-NPU server | ≤700W per GPU; DGX H200 system: 10.2kW | Up to ≈1.1kW in HGX; DGX B300: 14.5kW stated consumption, 15kW maximum input |
B300 note: Official NVIDIA documents report these two sets of values depending on the document/configuration: 288GB and 8TB/s in the HGX B300 reference architecture, and 270GB and 7.7TB/s in the Blackwell Ultra datasheet. NVIDIA reference architecture · Blackwell Ultra datasheet
Ascend specifications come from the current Atlas 350 and Atlas 650E pages; NVIDIA specifications come from official H200, HGX and DGX documentation. The power figures are not measured at the same level. A separate public 950DT thermal design power (TDP) figure is unavailable here, while Huawei gives the complete server’s power. This table therefore does not support a direct per-chip efficiency calculation. Ascend specifications · DGX B300 user guide
The table shows something more useful than a winner.
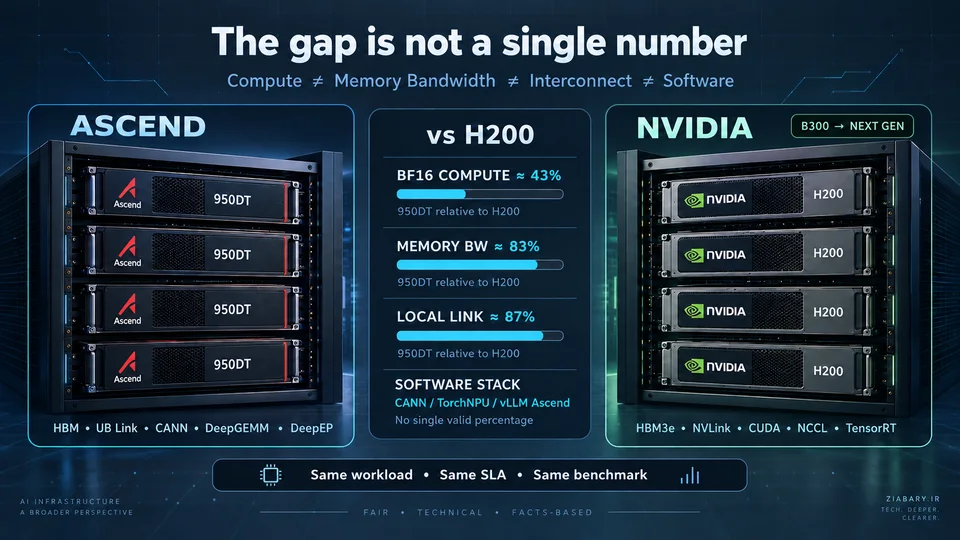
The current 950DT has about 43% of H200’s theoretical BF16 throughput and 41% of its FP8 throughput. Yet it has about 83% of H200’s memory bandwidth and 87% of its stated local-link bandwidth. Against B300, the compute gap is much wider: 950DT has less than one-fifth of the raw compute, about half the memory bandwidth and roughly one-third of the memory capacity in the current Atlas 650E.
Ascend can have around 40% of NVIDIA’s compute capacity while exceeding 80% of its memory bandwidth. Which ratio matters depends on the workload.
Why 4TB/s on 950DT matters more than it first appears
In the article on inference latency and throughput, I used a simple approximation:
Here, is the amount of computation, is compute throughput, is the data that must be transferred, and is memory bandwidth. If the second term dominates, adding FLOPS does not necessarily make the operation faster.
The same relationship gives a simple threshold:
A kernel with arithmetic intensity below this threshold is more likely to be limited by memory bandwidth; above it, compute capacity becomes more important.
Using theoretical BF16 throughput gives these approximate values:
| Accelerator | BF16 | Memory bandwidth | Approximate |
|---|---|---|---|
| Ascend 950PR / Atlas 350 | 425TFLOPS | 1.4TB/s | ≈304 FLOP/Byte |
| Ascend 950DT / Atlas 650E | 425TFLOPS | 4.0TB/s | ≈106 FLOP/Byte |
| H200 SXM | ≈990TFLOPS | 4.8TB/s | ≈206 FLOP/Byte |
| B300 HGX | ≈2.25PFLOPS | 7.7–8TB/s | ≈281–292 FLOP/Byte |
These are not benchmark results. They are ratios of theoretical specifications, but they help explain the different designs of 950PR and 950DT.
During prefill, especially with larger batches, matrix operations have higher arithmetic intensity, making more compute capacity useful. 950PR targets this phase while retaining 1.4TB/s of memory bandwidth.
During decode, particularly with smaller batches, the processor repeatedly reads model weights and the KV cache. Memory bandwidth matters more. In the Atlas 650E specification, 950DT raises bandwidth from 1.4 to 4TB/s without increasing BF16 throughput relative to Atlas 350.
For decode, Huawei changed the balance between compute and memory bandwidth rather than relying only on more FLOPS.
FP4 and FP8 labels do not guarantee comparable execution
The difficulty with low-precision comparisons goes beyond sparse versus dense computation.
Huawei supports mxFP4, mxFP8 and HiF8; NVIDIA uses NVFP4 and its FP8 formats in Blackwell. Equal bit widths do not imply equal numeric representations, scale factors, scaling granularity, kernels or output accuracy.
A claim that Atlas 350 is several times faster than H20 in FP4 has limited meaning without explaining the numeric path. H20 was not designed for the same FP4 execution path, so the ratio does not establish how much faster a real model will run. The numerical formats and actual kernel must accompany the comparison. Ascend processor specifications · Blackwell Ultra datasheet
In practice, record the weight format, activations, scale-factor format and kernel together. As I explained in “INT8 or FP8”, calling model weights “FP8” or “INT8” does not guarantee that matrix multiplication uses the same numeric path. BF16 is one of the main reference points here because it makes the architectural comparison more consistent, not because every deployment should use BF16.
Beyond the datasheet: does the complete workload run well?
A product page listing 4TB/s and 804TFLOPS does not demonstrate good performance for a real model. Available public evidence differs in scope and reliability. TPOT below means time per output token.
| Evidence | Hardware | What it measures | Result | Evidence quality |
|---|---|---|---|---|
| MLPerf Inference 6.1 | NVIDIA and several other vendors | Standardized models and workloads | Broad, comparable data | Standardized submission and review rules; Huawei is absent |
| CloudMatrix-Infer | 910C | Complete DeepSeek-R1 serving | 1,943 tokens/s/NPU at TPOT≈49.4ms | Huawei and SiliconFlow technical paper; not an independent test |
| DeepGEMM-Ascend | 950DT | Matrix-multiplication kernel (GEMM) | Up to 99.8% of the stated kernel ceiling | Open source and reproducible; not a complete-model benchmark |
| DeepEP-Ascend | 950DT | Communication for MoE models | About 90–95% of the payload-bandwidth ceiling through EP32 | Open source; tested on PoC HDK, with remaining limitations |
MLPerf Inference v6.1 was published in September 2026 with 30 submitters and 120 systems. Its Closed Division is intended for comparisons under common conditions. NVIDIA has extensive submissions, but Huawei is not in the submitter list. There is consequently no official MLPerf H200-versus-950DT comparison in these results. This is a major gap in the public Ascend evidence. MLCommons
The absence of a standardized test does not mean the hardware cannot run the workload. Equally, vendor tests cannot fill that gap and then be described as independent comparisons.
910C: the strongest current public evidence for complete-model execution
For the 950 generation, a comprehensive independent benchmark comparable to MLPerf remains unavailable. To assess the maturity of Ascend’s large-language-model serving stack, CloudMatrix384 based on 910C is still especially useful.
Serving Large Language Models on Huawei CloudMatrix384 examines DeepSeek-R1 on a system with 384 NPUs and 192 CPUs. With 4K inputs, default prefill throughput is 5,655 tokens/s per NPU. The 6,688 figure belongs to the idealized Perfect EPLB configuration, not the default run. During decode, a batch size of 96, KV-cache length of 4096 and TPOT of 49.4ms yield approximately 1,943 tokens/s per NPU.
The paper also includes H800 and H100 reference results. SGLang on H100, with a batch size of 128, reports about 2,172 tokens/s and TPOT≈55.6ms, while CloudMatrix, with a batch size of 96, reports 1,943 tokens/s and 49.4ms. Table 4 of the paper
These figures do not justify saying that Ascend is simply “10% slower than H100.” Batch sizes, numerical precision and serving software differ. Speculative decoding and multi-token prediction (MTP) also need to be controlled. The paper explicitly assumes an effective acceptance rate of 70% for one speculative token for both SGLang’s simulated MTP and CloudMatrix-Infer. That condition must stay attached to the result.
The evidence supports a narrower conclusion:
910C and its software stack can serve DeepSeek-R1 at substantial scale with competitive time per output token.
That matters for this technical comparison. A stronger conclusion would require a common test setup.
950DT: matrix kernels are no longer the obvious weak point
The 950 generation is newer, and complete-model evidence has not accumulated to the same extent as for 910C. A recent DeepSeek kernel benchmark nevertheless provides a useful view of its compute path.
DeepGEMM-Ascend was released on 30 September 2026. The reviewed README reports reproducible tests on Ascend 950DT with CANN 9.20. For the reported large matrix shapes, BF16 GEMM reaches 431TFLOPS against a 432TFLOPS ceiling, or 99.8%. FP8×FP8 reaches 861 of 865TFLOPS, and FP4×FP4 reaches about 1701 of 1730TFLOPS. DeepGEMM-Ascend README
These results do not show 950DT outperforming H200 or B300: NVIDIA is not part of the test. They show that, for suitable matrix shapes, the available kernel can use almost all of the stated matrix-compute capacity of this NPU. Poor performance on such paths can no longer be attributed automatically to a weak Ascend compiler.
An LLM execution path contains more than a few large matrix multiplications. Attention, normalization, sampling, cache management, communication, scheduling and smaller operations can still become bottlenecks.
MoE needs fast communication as well as compute
For mixture-of-experts (MoE) models, communication can matter as much as compute capacity. Tokens must be dispatched to experts and their results combined. With expert parallelism, all-to-all exchanges can consume a substantial share of decode time.
DeepEP-Ascend on 950DT reports about 373–375GB/s for dispatch at EP=8, retaining 335–340GB/s at EP=32. The project describes roughly 90–95% utilization of the physical payload-bandwidth ceiling through EP32. Performance falls further at EP64 and EP128, while combine performance also weakens; the developers explicitly identify ongoing optimization work. Here, EP is the size of the expert-parallel group. DeepEP-Ascend
The measurements were made on proof-of-concept hardware development kits (PoC HDK) with specific firmware. A production Atlas 650E should not be assumed to reproduce these values unchanged. The benchmark is promising and its method is published, but hardware status and software versions belong alongside every performance number.
Software: the gap may matter more than the hardware difference
“Will the required libraries run?” can be a more useful question than a FLOPS comparison.
PyTorch on Ascend is real and practical, but CUDA compatibility is not complete.
TorchNPU 26.1 officially supports 950DT. Huawei preserves much of PyTorch’s API and development workflow; some interfaces are connected to the NPU through runtime patching. TorchNPU documentation
Code built from standard PyTorch operators can be relatively straightforward to migrate. An application using a CUDA extension, a custom kernel, a CUDA-specific library, particular NCCL behavior or an operator missing from CANN/TorchNPU is a different case. Huawei documents a separate operator-adaptation process, acknowledging that not every operator transfers without additional work. Operator adaptation guide
Changing .cuda() to .npu() may be enough for a simple demonstration. It is not a reliable estimate of the migration effort for a production application.
vLLM: much more substantial support than a peripheral experiment
For LLM serving, the current position is more encouraging.
The vLLM Ascend support matrix for 950DT lists models including DeepSeek V4, DeepSeek-V3.1 and GLM-5.1, with capabilities such as W8A8, chunked prefill, prefix caching, speculative decoding, expert parallelism, data parallelism and prefill–decode disaggregation. vLLM Ascend support matrix
The official container image vllm-ascend:v0.23.0-a5 is documented for 950DT, with multi-node deployment instructions for models such as GLM-5/5.1.
However, not every support-matrix entry is fully supported. Some models are experimental, some features remain untested, and LoRA or pipeline parallelism is limited for certain configurations. “vLLM is supported” is therefore insufficient. The useful question is:
Which model, which quantization, which features and which Ascend generation?
The same discipline applies to a broad claim that a GPU “supports FP8.”
Training: the public evidence does not establish parity
950DT targets decode and training, with considerably more memory and interconnect bandwidth than its predecessor. TorchNPU provides a PyTorch training path. The claim that models cannot be trained on Ascend is incorrect. Huawei
But feasibility is only the first question. For a large training job, model FLOPs utilization matters:
How much utilization survives at 64, 256 or several thousand accelerators? What is the cost of collectives? How does failure recovery affect throughput? How are checkpointing and optimizer-state sharding handled? How much data exchange does expert parallelism introduce? How much of theoretical compute capacity does the compiler retain on the actual model?
For NVIDIA, extensive MLPerf Training results, public cluster experience and development and monitoring tools are available. Recent MLPerf training workloads also cover MoE and DeepSeek-V3. MLCommons
For Ascend, public standardized results do not yet place 950DT beside B300 or H200 under the same conditions.
DeepGEMM demonstrates effective use of matrix compute. DeepEP demonstrates substantial communication software. Together, they still do not constitute a complete training benchmark. For the technical choice of hardware for very large-scale pretraining, NVIDIA’s public evidence remains much more complete.
Inference: where the comparison can become much closer
Inference, especially decode, changes the picture.
The current 950DT product has about 43% of H200’s BF16 throughput, but 83% of its memory bandwidth. When decode is primarily bandwidth-limited, the real performance ratio need not match the compute ratio.
CloudMatrix results on the earlier 910C support this point. With suitable kernels, memory, communication and serving software, an NPU with lower peak compute than H100 can deliver competitive throughput and time per output token for a particular workload.
The 950 design reinforces the distinction: 950PR’s 1.4TB/s targets a more compute-intensive phase, while 950DT’s 4TB/s targets workloads more dependent on memory and communication. Huawei
For LLM serving, this differentiation is more informative than a FLOPS increase alone. vLLM Ascend’s support for prefill–decode disaggregation on 950DT also follows this direction. vLLM support matrix
Interconnects: NVLink remains important, but the comparison is not simple
H200 provides up to 900GB/s through fourth-generation NVLink, while B300 provides 1.8TB/s through the fifth generation. In HGX B300, eight GPUs connect through NVSwitch with 14.4TB/s of aggregate bandwidth. NVIDIA HGX
In Atlas 650E, each NPU has 784GB/s of bidirectional UB bandwidth within the eight-NPU server. Two servers can form a 16-NPU full mesh, with bandwidth reaching 1.68TB/s per NPU. UBoE and RoCE also provide 400Gbps each per NPU for scale-out communication. Atlas 650E
Putting 784 beside 900 suggests a small gap, but that comparison is incomplete. Topology, latency, collective implementations, endpoint counts and the communication pattern in which bandwidth is available matter more than an aggregate specification. For MoE, actual dispatch and combine time under expert parallelism is especially important. DeepEP’s measured behavior is therefore more useful than the 784GB/s figure alone.
Scale is another way to compensate for weaker individual chips
CloudMatrix384 illustrates this strategy: Huawei connects 384 NPUs within a large communication domain. SemiAnalysis estimated approximately 300 dense BF16 PFLOPS, 49TB of memory and over 1.2PB/s of aggregate memory bandwidth, exceeding GB200 NVL72 at the system level. The same analysis identifies the trade-off: many more accelerators and several times the power consumption. These are system-level estimates, not evidence of equal per-chip performance. SemiAnalysis comparison
Huawei can compensate for part of the per-chip gap by engineering a system with more interconnected accelerators.
That is a valid architectural approach, but it has costs: more racks, optical equipment, network complexity, a larger failure domain and higher electricity demand all contribute to total cost of ownership.
Total cost of ownership: the accelerator is only one line item
A meaningful cost comparison needs actual quotations for the proposed configurations, rather than a generic card-price ratio. Total cost of ownership includes the accelerator, host server, networking, electricity, cooling, software, migration, support and spare parts:
For serving, the cost per token delivered within the service target is more useful than total cost alone:
A system producing twice as many tokens does not necessarily offer more useful capacity if its time per token exceeds the agreed limit.
Ascend is not automatically the lower-power choice. Atlas 650E with eight 950DT processors lists about 14.5kW for the complete system. The eight-GPU DGX H200 specifies up to 10.2kW. DGX B300 lists 14.5kW of system consumption, while its user guide gives 15kW as maximum system input power. Stated consumption and maximum input are different specifications. Differences in CPUs, networking and system design also prevent these figures from establishing performance per watt by themselves. Atlas 650E · DGX B300 guide
Measure tokens per joule, tokens per second per rack and tokens per second per dollar, with the same model, context-length distribution, concurrency and service targets. Without those conditions, a card-price comparison is incomplete.
How large is the real gap?
The available evidence supports a layered assessment:
| Layer | Current technical position |
|---|---|
| Raw compute per accelerator | Clear NVIDIA advantage; the current 950DT has about 40% of H200’s BF16/FP8 throughput and less than 20% of B300’s |
| Memory bandwidth | Much closer to H200: 4 versus 4.8TB/s |
| Memory capacity | Current Atlas 650E 950DT trails H200 and B300; 950PR is closer to H200 |
| LLM decode | The performance gap can be much smaller than the FLOPS gap |
| Prefill | Compute capacity matters more; 950PR specifically targets this phase |
| MoE communication | Working software and promising results, but large expert-parallel groups still need improvement |
| PyTorch | Official support; no guarantee that CUDA-dependent code runs unchanged |
| vLLM | Substantial active support, with differences in supported models and features |
| Large-scale training | Feasible, but independent public evidence does not establish parity |
| Standardized benchmarks | A major evidence gap for Ascend; Huawei is absent from the current MLPerf results |
| Complete-model inference | Real evidence exists, mainly from the vendor or its partners |
| Total cost of ownership | Requires workload measurements and actual configuration prices |
The evidence does not justify saying that Ascend has reached NVIDIA across the board. It also does not support dismissing Ascend as technically unusable.
The current 950DT has a substantial raw-compute gap against H200, and especially B300, but a much smaller gap in memory bandwidth and stated local-link bandwidth. Decode and some communication-heavy workloads may consequently show a smaller complete-model performance gap than the TFLOPS comparison suggests.
For very large-scale training, or workloads relying on custom CUDA extensions, highly optimized kernels and mature development tools, software differences can matter even more than silicon specifications. This is where a theoretical comparison should give way to a measurement.
The experiment I would like to run
Given an Atlas 650E or even an A3 system, I would migrate a real workload currently running on NVIDIA to Ascend without simplifying it. Use the same model, tokenizer, context-length distribution, concurrency sweep and service targets.
Record time to first token (TTFT), time per output token (TPOT), output-token throughput, in-flight requests, HBM utilization, KV-cache capacity, system power and failures during a 24- or 72-hour run.
Also measure migration engineering time. How many lines of code changed? Which operators failed? Which kernels had to be replaced? Which quantization paths were unavailable? Once the model ran, how many days of tuning were needed to reach acceptable performance?
That engineering effort belongs in the benchmark because it affects the deployment decision.
The Ascend–NVIDIA gap is not one percentage. BF16, memory bandwidth, decode and the software ecosystem each produce a different comparison.
The useful question is:
For this model, serving engine, service target and scale, what does Ascend give up, and how much of the required capacity can it actually deliver?
Until that question is measured on real hardware, both a blanket claim of equivalence and a blanket dismissal are premature. The answer needs a workload benchmark.