GPU selection often starts with memory capacity and peak compute performance. If the model’s weights fit and its numerical format appears on the specification sheet, compatibility can look settled. Moving an INT8 model to a newer GPU can expose the weakness in that assumption: the model may fail at execution time or perform very differently from expectations.
The GPU selection guide uses workload fit and operating cost as the main decision criteria. This article examines one detail behind that decision: whether the software actually uses the capability being purchased. The focus is language-model inference. Training and other integer-compute workloads require their own evaluation.
INT8 and FP8 describe different numbers
INT8 and FP8 both use eight bits for the base representation of each value, but they do not encode that value in the same way. In common INT8 quantization schemes, an integer and a scale approximate a real number. Reconstructed values within a group sharing a scale are evenly spaced. FP8 assigns some bits to an exponent, so the spacing changes with magnitude. FP8 also typically needs scaling, as described in the TensorRT quantization documentation.
FP8 itself has multiple representations. E4M3 uses four exponent bits and three mantissa bits; E5M2 uses five and two, trading precision for a wider range. NVIDIA’s Transformer Engine primer explains the distinction. Floating-point representation alone does not guarantee a smaller error for a particular model.
In quantized-model names, W refers to weights and A to activations—the intermediate values passed through the layers. W8A8 specifies the bit widths of those two groups. It does not, on its own, identify integer or floating-point computation.
| Model description | Meaning | What still needs checking |
|---|---|---|
| INT8 W8A8 | Weights and activations in the quantized operations use eight-bit integers | Scaling, kernel support and excluded layers |
| FP8 W8A8 | Weights and activations in the quantized operations use eight-bit floating point | FP8 variant, scale format and operation coverage |
| W8A16 with INT8 weights | Weights are compressed; activations use sixteen bits | Weight reconstruction and the actual matrix-multiplication precision |
| FP8 KV cache | Attention keys and values are quantized | Weight formats and layer computation are configured separately |
These distinctions also appear in the vLLM quantization documentation. Accumulation precision is another independent choice: INT8 inputs, for example, can use INT32 accumulation. “An eight-bit model” does not describe every operation in the model.
Weight memory is only part of the requirement
Exactly 70 billion parameters stored at one byte each occupy 70 decimal GB, or about 65.2 GiB. That raw figure is the same for INT8 and FP8. It excludes scales, higher-precision layers, temporary buffers and runtime memory.
The KV cache also grows with context length and active requests. As the vLLM KV-cache guide explains, its format is configured separately. Quantizing the weights to eight bits does not automatically quantize the cache.
Measure memory at the required input length, output length and concurrency. Successfully loading a model does not establish the capacity to serve it. This extends the GPU product-family comparison: additional memory may make deployment possible, but service capacity depends on the whole working set.
The INT8/FP8 balance changes on B300
The difference between B200 and B300 is a useful example. The following figures are nominal dense rates per GPU. B200 and B300 use Table 3 on page 25 of NVIDIA’s Blackwell Architecture Technical Brief. The H200 SXM figures are obtained by removing the sparsity multiplier from the vendor’s published rates.
| GPU and reference configuration | Dense FP8, TFLOPS | Dense INT8, TOPS | Nominal FP8/INT8 rate ratio |
|---|---|---|---|
| H200 SXM | 1,979 | 1,979 | 1:1 |
| B200 in HGX | 4,500 | 4,500 | 1:1 |
| B300 in HGX | 4,500 | 150 | Approximately 30:1 |
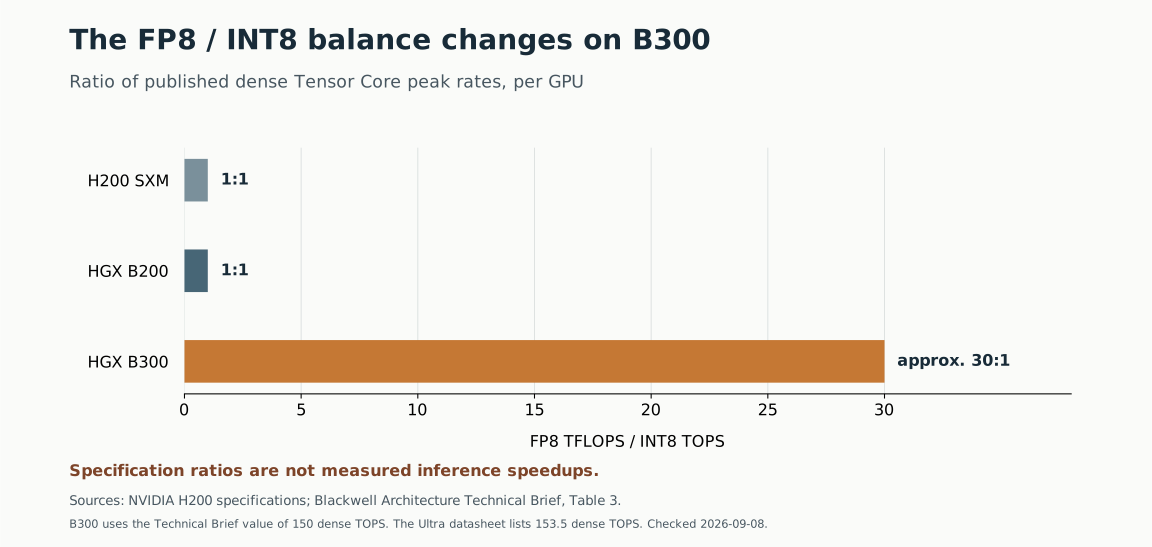
The Blackwell Ultra datasheet, page 5, lists 307 sparse INT8 TOPS for HGX B300, equivalent to 153.5 dense TOPS. The technical brief uses the rounded value of 150, which is the basis of this chart. Do not mix these figures with the GB300 NVL72 column or other configurations. The DGX/HGX comparison explains why platform distinctions matter.
There is also a difference between those documents and the live HGX product table, checked on 9 September 2026. The latter lists 3 sparse INT8 POPS for an eight-GPU HGX B300, equivalent to 187.5 dense TOPS per GPU. That is the basis used by the interactive comparison in this collection; against 4,500 dense FP8 TFLOPS, its ratio is 24:1. The chart above deliberately retains the technical brief’s 150-TOPS basis. These published figures are not identical, so preserve the source and configuration with every comparison and confirm the applicable specification for a purchase.
The reduction in nominal INT8 rate in this example occurs between B200 and B300; it does not apply to every Blackwell product. TFLOPS and TOPS also describe different types of operations here. Their ratio does not mean that an INT8 model will run thirty times more slowly.
From the specification sheet to an executable kernel
A kernel in this discussion is a compute function running on the GPU, such as a layer’s matrix multiplication—not the operating-system kernel. Three things must line up: the instruction must be valid for the target architecture, the library must provide a suitable implementation, and the execution engine must select it for the model.
Version 2 of the August 2026 preprint Spec Sheets Are Not Kernels audits that chain for Blackwell Ultra. It examines documentation and code at specified versions; it does not report speed or model-quality benchmarks. Its findings must be read within that scope.
| Layer | Finding in the case study | Limit of the conclusion |
|---|---|---|
| GPU instruction | PTX 9.3 lists tcgen05.mma with .kind::i8 for sm_100a, but not sm_103a | The absence of this fifth-generation path does not remove every INT8 capability |
| CUTLASS | At commit dcf215a, the generator excludes INT8 UMMA generation for target 103a | SM100 behavior cannot simply be assumed for SM103 |
| vLLM | The SM100 W8A8 path at commit 6c95a641 has no INT8 implementation | Even B200’s hardware capability is not necessarily used through this path |
| SGLang | The INT8 kernel examined at commit b20c375 covers architecture paths through Hopper | The finding concerns that kernel, not every INT8 method in SGLang |
The direct references are the PTX instruction manual, CUTLASS generator, vLLM operation-selection code and SGLang kernel. The code links deliberately pin commits. Check the installed version separately.
In the vLLM case, an initial compatibility check can pass before the missing compute path is exposed by the model’s first execution. A compatibility test must therefore continue at least as far as producing output. A smaller model using the same quantization method may expose the problem sooner, but final acceptance still requires the intended model: matrix shapes and model architecture can change kernel selection.
The study also discusses disabling a CUTLASS kernel with VLLM_DISABLED_KERNELS and examining a Triton fallback. That mechanism was tested on Ada, without a measured B300 performance result. The presence of a fallback is not sufficient evidence to recommend it for a B300 deployment.
Record the driver, libraries and execution-engine versions alongside the test results. The maintenance and security implications of this dependency chain are discussed in AI infrastructure security starts with the kernel and GPU.
Peak rates do not determine response time
Execution time depends on memory traffic, matrix dimensions, parallelism and implementation quality. NVIDIA’s matrix-multiplication performance guide describes how the ratio of operations to transferred data helps determine whether an operation is compute-bound or memory-bound.
Language-model prefill and token-by-token decode have different execution patterns. Increasing concurrency can improve compute utilization, but it also changes memory use and queuing delay. When FP8 and INT8 use different implementations, the benchmark compares complete configurations; the entire difference cannot be attributed to the numerical format.
Multi-GPU execution adds communication costs. Evaluate PCIe and SXM connectivity alongside precision. A higher arithmetic peak cannot compensate for a bottleneck elsewhere in the execution path.
Changing format requires a quality evaluation
If FP8 has a better-supported path on the target hardware, a migration is worth testing. Reinterpreting INT8 bytes as FP8 is not a valid model conversion. The numerical mapping and scales differ. When higher-precision weights are available, preparing the target quantization from those weights avoids adding another conversion on top of an already quantized representation.
Quality depends on the preparation method. SmoothQuant, for example, handles activation outliers to enable W8A8 with little degradation in its reported evaluations. A 2025 ACL study of quantization quality and efficiency examines several formats in the Llama-3.1 family under different deployment conditions. Neither result guarantees quality for a particular organization’s documents, language mix or specialized terminology.
Use test data that reflects the work: extracting amounts and names, preserving negation and conditions, producing evidence-based answers and returning structured output. A harmless change in wording is not equivalent to omitting a contractual condition or changing a monetary amount. Compare the quantized model with the baseline in a way that distinguishes those errors. For multilingual or domain-specific services, include the scripts, terminology and document structures that users actually submit.
Ask for a reproducible service test
A purchasing request should name an executable configuration: model version, quantization method, runtime, GPU and workload. The following information makes competing proposals meaningfully comparable.
| Area | What the test report should record |
|---|---|
| Model and environment | Weight version or hash, quantization method, GPU model, driver and runtime versions |
| Actual execution | Output from the intended model and the selected kernels for dominant operations |
| Capacity | Memory use at the target input length, output length and concurrency |
| Quality | Application-relevant errors against the baseline on representative data |
| Responsiveness | Time to first token, subsequent-token timing and latency percentiles |
| Cost | Usable serving capacity, model conversion and configuration maintenance |
The vLLM discussion of serving metrics distinguishes raw output rate from goodput: capacity that meets service targets. For an interactive application, the number of requests served within acceptable quality and latency limits is more useful than the largest token rate in an isolated run. Report loading and warm-up time separately from steady-state measurements.
If an existing INT8 deployment meets the service’s needs, the release of another GPU generation is not, by itself, a reason to migrate. For a new deployment, include model preparation, quality testing and software maintenance in the purchase comparison. A more expensive GPU with a mature FP8 path may cost less to operate, or retaining the current infrastructure may be the better choice. The same model and service test should decide between them.
Sources and numerical basis
Sources are linked beside the claims they support. The chart uses H200 specifications and Table 3 of the Blackwell technical brief; its downloadable data records the basis for each row. The source article’s numerical review date is 8 September 2026.
The software findings refer to the versions examined in the August 2026 study. This article does not report an independent B300 benchmark, and the underlying study did not audit TensorRT-LLM. The TensorRT reference near the beginning explains numerical formats only.