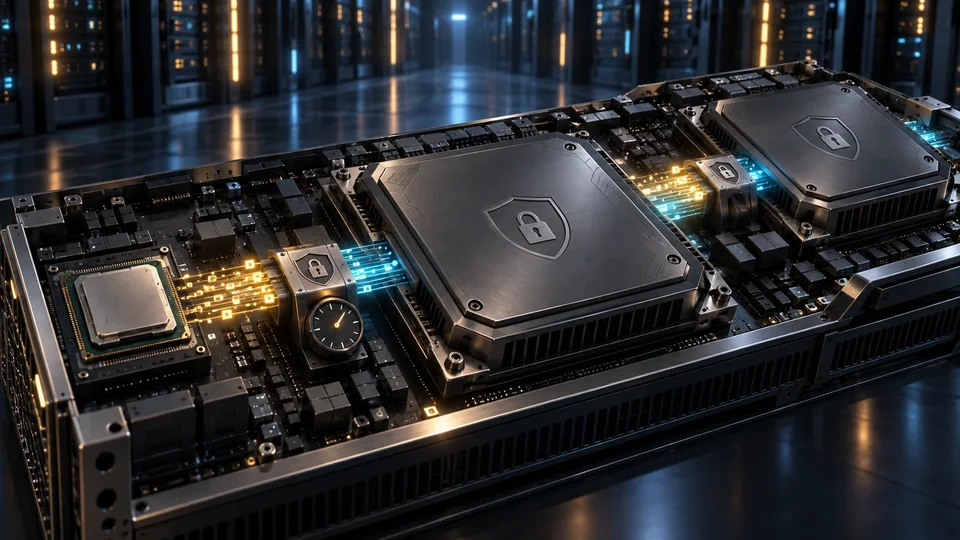
From command submission and PCIe transfers to encrypted NVLink and the inference stack
Confidential computing aims to protect data, model weights and intermediate execution state even from the infrastructure administrator, host operating system and hypervisor. To assess its cost, we need to ask which parts of execution incur overhead, how much of each request is spent there, and how the software stack hides or amplifies that cost.
A recent preprint on confidential computing performance on NVIDIA B200 reports two apparently conflicting results: inference overhead of roughly 1–3% with a properly configured stack, and throughput losses of 30–40% in some unpatched configurations.
The article on actual INT8 and FP8 support showed why nominal format support does not guarantee that a workload uses it. The article on latency and throughput explained why the fastest GPU does not necessarily produce the fastest response. This third installment in that sequence within the GPU selection guide goes one layer deeper: even with the hardware and model held constant, the security architecture and inference software determine the cost of protecting the data.
What, exactly, becomes confidential?
In the tested system, an Intel TDX confidential VM protects CPU memory and state from the host, while NVIDIA Confidential Computing extends protection to the GPU.
The earlier discussion of infrastructure security from the kernel to the GPU examined access through lower layers of the system. Here we examine the cost of protecting those boundaries:
- VM memory and CPU state;
- host-memory-to-GPU transfers over PCIe;
- GPU memory;
- the command path from the host to the GPU management processor;
- communication between GPUs over NVLink;
- and the attestation chain for hardware, firmware and the execution environment.
In Intel TDX, the VM’s private memory is isolated from the virtual machine monitor, or VMM, and host software.
According to NVIDIA’s confidential computing guide, Blackwell also supports encrypted NVLink in multi-GPU mode. CPU–GPU transfers can use encrypted bounce buffers or, on compatible platforms, TDISP/IDE.
Enabling encryption therefore affects several boundaries, each with a different cost pattern.
Which system do these measurements describe?
This article analyzes version 2 of the preprint, published on 1 September 2026. The measurements below belong to the paper’s authors; they are not experiments conducted for this article.
| Component | Test configuration |
|---|---|
| Host | Dual-socket Intel Xeon 6767P server |
| GPUs | Eight NVIDIA B200 GPUs connected through NVLink |
| Confidential environment | Intel TDX with NVIDIA CC |
| Operating system | Ubuntu 24.04.3 |
| Guest driver | NVIDIA 595.71.05 Open Driver |
| Inference engines | SGLang 0.5.13.post1 and a patched branch; vLLM 0.21.0 and 0.22.0 |
| Models | Dense and MoE models using NVFP4, FP8, AWQ and bf16 |
| Comparison | Paired CC-on and CC-off runs on the same host, disk and GPUs |
Within each comparison, the hardware is held constant and TDX/CC is toggled. Framework versions, models and configurations differ across experiments, however. Comparisons within a row are more informative than treating unrelated rows as interchangeable.
The authors also report that clean measurements required a reboot. Residual GPU state produced an apparent 16% overhead in one run, whereas a clean run of the same workload showed about 2%. Leftover state can therefore create a difference much larger than the overhead being measured.
Compute is not the main bottleneck
The paper’s central finding is that matrix multiplication, GEMM and HBM access were not the main sources of overhead in this configuration. Most of the cost appeared at communication boundaries:
- host-to-GPU command submission;
- CPU–GPU transfers over PCIe;
- GPU–GPU communication over encrypted NVLink.
The arithmetic itself did not necessarily become slower. Delivering commands and data, and coordinating GPUs, became more expensive.
First cost: every small command has a fixed price
When the host launches a kernel, the command passes through a protected control path to the GPU System Processor, or GSP. The study measured roughly 12 additional microseconds per kernel submission on one GPU:
| Operation | CC off | CC on | Difference |
|---|---|---|---|
| Kernel submission | 3.45 µs | 15.7 µs | About 12 µs |
| Synchronization without submission | 1.62 µs | 1.67 µs | Almost zero |
Twelve microseconds becomes significant when a decoding step contains dozens or hundreds of separate submissions. In the paper’s microbenchmark, a step contained about 181 kernels. Eager execution submitted them again on every step:
| Execution mode | CC off | CC on | Time ratio |
|---|---|---|---|
| Eager | 2,644 µs per step | 6,358 µs | 2.41× |
| Full CUDA graph | 2,500 µs | 2,589 µs | 1.04× |
A CUDA graph records the operations in advance and replays a graph instead of submitting hundreds of individual commands. In this microbenchmark, that reduced a large control-path penalty to a few percent.
“CUDA graphs enabled” is not a sufficient description, though. A framework that splits the graph at every attention layer can still leave roughly 185 host submissions per step. The actual submission count matters more than the setting’s name.
A rough expression for this cost is:
The shorter the compute step and the more submissions it contains, the larger the contribution of that fixed cost.
Second cost: encrypted PCIe is about more than bandwidth
In this stack, host–GPU transfers use AES-GCM and driver-managed bounce buffers. Large transfers pay a cost roughly proportional to their byte count. Small transfers are more sensitive to cryptographic setup and call overhead.
In the paper’s tests:
- the transfer rate was 7.21 GB/s at 1 MB and roughly 9.4–9.6 GB/s at 16 and 64 MB;
- transfers of 64 KB or less were dominated more by a fixed overhead of about 3–6 µs;
- adding host threads did not improve encryption throughput for one GPU session.
This limitation is visible during initial weight loading. If weights and the KV cache remain on the GPU afterward, it need not recur in every token’s critical path.
The more damaging problem was reading the sampling result back from the GPU at the end of each decoding step. In the unpatched stack, a small device-to-host copy that should overlap the next step’s computation effectively became synchronous and stalled the scheduler. The GPU waited, utilization fell, and the throughput loss exceeded the time spent on AES computation itself.
That is where the 30–40% result emerges.
Why does one experiment show 39% and another less than 1%?
With released, unpatched SGLang, Qwen3-8B on one B200 with overlap enabled produced these results:
| Concurrency | Throughput without CC, tokens/s | Throughput with CC, tokens/s | Throughput loss |
|---|---|---|---|
| 16 | 3,828 | 2,513 | 34.4% |
| 32 | 6,931 | 4,534 | 34.6% |
| 64 | 11,137 | 6,805 | 38.9% |
At concurrency 64, time per output token rose from 5.48 to 8.28 ms, and time to first token from 259 to 409 ms. The “39%” refers to lost throughput; some latency measures increased by more than that.
The small D2H copy no longer hid behind computation. Scheduling became serialized, and GPU utilization fell from 74% to 57%.
After moving D2H copies to an asynchronous worker and applying CC-compatible fixes, a separate single-GPU experiment with Qwen2.5-72B-AWQ showed overhead between −0.2% and +0.6% across concurrency settings: effectively measurement noise. This was a different model, not a before-and-after comparison on the same model. Across ten input/output shapes, median overhead was 1.2% and the worst result was 6.5%.
The 30–40% loss is therefore not an inherent GPU encryption tax. It is an interaction between confidential mode and a specific unpatched stack. Near-zero overhead is also configuration-dependent: the framework, model and workload shape still matter.
Third cost: encrypted NVLink
Adding a second GPU introduces another path. Collective operations such as all-reduce and all-to-all must run over encrypted NVLink.
A microbenchmark on four B200 GPUs in one NUMA node reported:
| Metric | CC on, GB/s | CC off, GB/s | Calculated reduction |
|---|---|---|---|
| Copy Engine, one-way read | 8,070 | 9,170 | 12.0% |
| Copy Engine, one-way write | 8,278 | 9,292 | 10.9% |
| SM-based read | 7,693 | 9,388 | 18.1% |
| NCCL all-reduce | 156 | 185 | 15.7% |
| NCCL all-to-all | 130 | 149 | 12.8% |
The NCCL percentages are calculated from the values in each row; the original table’s “10%” labels do not match those values. The Copy Engine and SM rows are the reported D2D benchmark metrics, not a single NVLink connection’s bandwidth specification. Median latency for a small P2P write also increased from 3.7 to 14.5 µs, almost fourfold.
These results do not imply a 10–18% loss for the entire service. The end-to-end effect depends on the share of each step spent communicating between GPUs.
If a collective occupies only 20% of the critical path and encryption makes that part 10% slower, its direct contribution to total time is much smaller than 10%. A workload that is almost entirely communication-bound is more exposed to the raw communication penalty.
This is another reason the difference between PCIe and SXM is more than a mounting detail: the route and volume of GPU communication also affect confidential execution costs.
Two independent dimensions of overhead
| Cost dimension | Behavior | Ways to reduce it |
|---|---|---|
| Fixed host-operation cost | Repeats with submissions, synchronization and readbacks | More complete CUDA graphs, fewer graph splits, asynchronous D2H worker |
| NVLink traffic cost | Varies with encrypted inter-GPU traffic | Fewer unnecessary collectives and suitable parallelism |
Larger batches can spread fixed submission costs across more requests. They can also increase collective traffic. Batching may improve the first dimension while making the second more visible until it reaches a plateau. There is no single batch size that minimizes both costs for every workload.
Under which conditions was the 1–3% result obtained?
The principal multi-GPU result concerns MiniMax-M2.7, an MoE model with about 229 billion total parameters and 6 billion active parameters, on eight B200 GPUs.
At the reference point of 1,024 input tokens, 2,048 output tokens and concurrency 32:
- TP8 showed 2.8% and 3.6% overhead in two sets of five repeated runs;
- TP4 showed about 1.5% overhead;
- halving the tensor-parallel width to TP4 retained 94% of TP8 throughput.
“About 1–3%” describes a particular performance regime: a patched stack with piecewise CUDA graphs and overlap enabled, a decoding-heavy workload, and parallelism suited to the model. It is not a result for every workload or every configuration of the same server.
| Measured scenario | Reported overhead | Main mechanism |
|---|---|---|
| One GPU, overlap off | About 2% | Residual command-path cost |
| One GPU, overlap on, unpatched | 34–39% | Lost compute/copy overlap |
| One GPU, graphs and patched stack | Below 1% in the main sweep | Cost removed from the critical path |
| MoE with TP8 | About 2.8–3.6% | Encrypted all-reduce |
| MoE with TP4 | About 1.5% | Less NVLink traffic |
| Qwen3.5 with DP-attention and EP, 32,768-token input | About 2% | No attention all-reduce |
| Eight-GPU training | 11–24% longer steps | Frequent training collectives |
Inference rows measure throughput loss; training measures increased step duration. Their denominators are different. The training configurations also differ substantially:
| Training test on eight GPUs | Step time without CC | Step time with CC | Time increase |
|---|---|---|---|
| Dense bf16, TP8 | 13.95 s | 15.8 s | 13.3% |
| Dense delayed FP8, TP8 | 14.5 s | 18.0 s | 24.1% |
| Tuned MoE, EP8 | 2.16 s | 2.40 s | 11.1% |
These percentages are calculated from the reported step times. The FP8 experiment has the largest increase.
How does output length change the result?
In a MiniMax-M2.7 sweep with TP8, 1,024 input tokens and concurrency 32, longer outputs spread the encrypted prefill cost across more decoding steps:
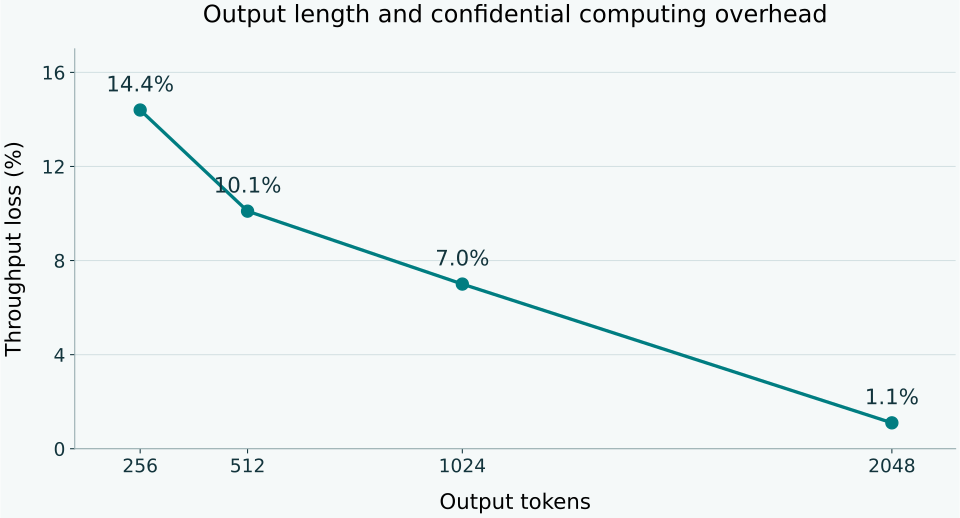
| Output tokens | Without CC, tokens/s | With CC, tokens/s | Throughput loss |
|---|---|---|---|
| 256 | 1,701.0 | 1,456.0 | 14.4% |
| 512 | 2,300.5 | 2,068.4 | 10.1% |
| 1,024 | 2,551.4 | 2,371.6 | 7.0% |
| 2,048 | 2,530.7 | 2,504.0 | 1.1% |
The chart uses the paper’s sweep values. Most points were single passes over random data, and the authors report variation of roughly two percentage points. Five-repeat measurements at the same 1,024-input/2,048-output shape yielded 2.8–3.6%, not 1.1%. The chart supports the direction of change more strongly than the final decimal place of each point.
In this experiment, prefill occupied a larger share of total execution time for short responses. Longer decoding reduced its relative contribution.
Longer context does not always reduce overhead
The effect depends on parallelism. In the MiniMax-M2.7 NVFP4 experiment on four GPUs with TP2/EP4/DP2, increasing input from 4,096 to 32,768 tokens raised overhead from 9% to 14.5%, associated with more prefill all-reduce traffic.
In the Qwen3.5-397B-A17B FP8 experiment on eight GPUs with DP8/EP8, attention did not require inter-GPU all-reduce. Over the same input range, overhead fell from 11.1% to 1.9%. More computation amortized fixed costs and expert communication.
These experiments differ in model, numerical format and GPU count, so the difference cannot be attributed solely to parallelism. Both used 256 output tokens and concurrency 32.
“Longer context reduces CC overhead” is therefore as incomplete as its opposite. The determining question is how much additional computation and how much additional encrypted communication the longer context creates.
More parallelism is not always better
Tensor parallelism exchanges parts of activations between GPUs at each layer, usually through all-reduce. In confidential mode, that traffic is encrypted. If the model runs adequately without eight-way TP, spreading it across more ranks can simply increase communication.
At the paper’s reference point, reducing TP8 to TP4 approximately halved CC overhead to 1.5% while preserving 94% of throughput.
The lesson is not simply to use fewer GPUs. GPU count and the width of a tensor-parallel group are different concepts. A larger deployment can still keep each replica or TP group only as wide as the model needs.
For MoE models, expert and data parallelism may also require less synchronous communication than tensor parallelism. The choice must still be tested with the actual model, batch size, context length and topology.
The software stack is part of the security architecture
The comparison of Ollama, vLLM, SGLang and llama.cpp starts with the service’s requirements. For confidential execution, the data-transfer behavior of a specific software version becomes another selection criterion. Framework decisions determine how often a small hardware cost recurs and where it enters the critical path.
The study identifies several influential changes:
- use CUDA graphs and reduce graph splitting;
- move token readback to a separate asynchronous worker;
- avoid requesting unsupported pinned host memory;
- use the global timer rather than CUDA events in the autotuner;
- choose fusions that do not depend on multicast blocked in CC mode;
- keep weights and the KV cache resident on the GPU;
- avoid weight streaming, CPU expert offload and KV offload on the critical path;
- size TP for the model rather than for the available GPU count.
An NVIDIA report published on 2 July 2026 also emphasizes an asynchronous D2H worker, CC-compatible timing and piecewise CUDA graphs. Its HGX B300/Qwen3.5 tests report roughly 1–8% impact across workload shapes. Those numbers cannot replace or be pooled with the B200 measurements, but they also show the importance of the stack’s version and configuration.
What did the study not measure?
Startup and attestation
The study did not measure confidential VM creation, GPU initialization, secure-session establishment, CPU/GPU attestation or key delivery.
Attestation usually precedes the release of secrets and workload execution rather than recurring for every inference request. Startup time may still matter for short-lived workloads, aggressive autoscaling or serverless services. This study supplies no measurement for it.
Communication between hosts
All results come from one physical host. RDMA, multi-server GPU communication, prefill/decode disaggregation and inter-node KV-cache transfer were not benchmarked.
The paper explains that CC restricts GPUDirect RDMA and conventional pinned buffers in the tested stack. Transfers may have to follow a GPU–CPU–CPU–GPU path. That is an architectural issue, not a quantitative benchmark for multi-node clusters.
Security assurance
The study neither audited nor proved a security property. Resistance to a specified attacker, firmware security, supply chains, key management, attestation policy and side-channel coverage were outside the tests.
Administrator powers, logging and information recoverable from outputs still require a separate examination of indirect data access.
Other hardware
The results concern B200, Intel TDX and specific driver/framework versions. They cannot be directly transferred to H100, B300, other GPUs, AMD SEV-SNP, TDISP/IDE platforms or later software generations.
What should an acceptance test record?
A procurement or acceptance test should capture at least the following:
| Area | Required details |
|---|---|
| Hardware | CPU/GPU models, GPU count, NUMA and NVLink topology |
| Security | TEE type, CC mode, firmware version, attestation method |
| Software | Driver, CUDA, NCCL, framework and CC patch versions |
| Model | Weight version, precision, dense or MoE architecture |
| Workload | Input/output-length distributions, batch size, arrival rate |
| Parallelism | TP, PP, DP and EP, with each group’s width |
| Scheduling | CUDA graphs, piecewise graphs, overlap, chunked prefill |
| Memory | Weight/KV-cache location and offload settings |
| Results | TTFT, TPOT, throughput, goodput, errors, utilization |
| Lifecycle | Startup, attestation and key-delivery time where relevant |
| Scale | Single or multiple hosts and actual communication paths |
Run the same workload with and without CC on identical hardware and data. Repeat each point and report dispersion alongside the mean or median. A one- or two-percent difference in a single run may be no more than measurement noise.
Before choosing a configuration
If throughput loss rises from 34% to 39% as concurrency increases while GPU utilization falls, first investigate result readback and scheduling. If the loss grows with input length and collective traffic, TP width and inter-GPU communication become more relevant. These conditions call for different fixes.
In the paper’s reference configuration, TP4 retained about 94% of TP8 throughput with less confidentiality overhead. That comparison is more useful than a universal “CC tax”: which configuration serves the actual workload at the required latency and capacity?